%cd ../../data/hymind/home/steve/HyStakesWe need synthetic data.
We will inspect live data in this notebook, and then derive a short script that will generate suitable dummy data.
NOTE
This notebook will be be run manually.
That should happen from the project root directory where the readme.md and the .env file are stored.
The following changes to the project root assuming that the notebook kernel is normally starting from the same directory as the notebook itself.
%cd ../../data/hymind/home/steve/HyStakesimport os
from dotenv import load_dotenv
from pathlib import Path
import matplotlib.pyplot as plt
import numpy as np
import pandas as pd
from scipy.stats import poisson, lognorm
import sqlalchemy as sa%matplotlib inlineLoad environment variables and set-up SQLAlchemy connection engine for the EMAP Star
load_dotenv(dotenv_path=".env")
try:
    assert os.getenv("DOTENV_FILE_EXISTS") == 'TRUE'
except AssertionError:
    print("!!! ERROR: check that the .env file exists at the top level of the project")
    print("!!! ERROR: check that the relative path is correct")
# Construct the PostgreSQL connection
uds_host = os.getenv('EMAP_DB_HOST')
uds_name = os.getenv('EMAP_DB_NAME')
uds_port = os.getenv('EMAP_DB_PORT')
uds_user = os.getenv('EMAP_DB_USER')
uds_passwd = os.getenv('EMAP_DB_PASSWORD')
emapdb_engine = sa.create_engine(f'postgresql://{uds_user}:{uds_passwd}@{uds_host}:{uds_port}/{uds_name}')Here’s the very long query that I built.
It selects all patients on tower wards 2 weeks ago (336 hours), and then finds the age (rounded) and the last heart rate. The remaining data has no identifiers.
SELECT
 left(md5(lv.hospital_visit_id::TEXT), 6) id
--,lv.location_visit_id
--,lv.admission_datetime admit_dt_bed
--,lv.discharge_datetime disch_dt_bed
--,hv.admission_datetime admit_dt_hosp
--,hv.discharge_datetime disch_dt_hosp
,ROUND(EXTRACT(epoch FROM
    (hv.discharge_datetime - (NOW() - '336 HOURS'::INTERVAL)
    ))/3600) hours_to_discharge
--,hv.discharge_destination
--,hv.patient_class
--,lo.location_string
,dept.name department

-- include age rounded to 5
, ROUND(DATE_PART('year',AGE(cd.date_of_birth ))/5) * 5 AGE

-- add last heart rate
,hr.value_as_real pulse
--,hr.observation_datetime


FROM star.location_visit lv
LEFT JOIN star.location lo ON lv.location_id = lo.location_id
LEFT JOIN star.department dept ON lo.department_id = dept.department_id
LEFT JOIN star.hospital_visit hv ON lv.hospital_visit_id = hv.hospital_visit_id
LEFT JOIN star.core_demographic cd ON hv.mrn_id = cd.mrn_id
LEFT JOIN (
    WITH obs AS (
        SELECT

         vo.visit_observation_id
        ,vo.hospital_visit_id
        ,vo.observation_datetime
        ,vo.value_as_real
        ,ot.name

        FROM star.visit_observation vo
        LEFT JOIN star.visit_observation_type ot ON vo.visit_observation_type_id = ot.visit_observation_type_id
        WHERE
        ot.id_in_application = '8' -- heart rate
        AND
        vo.observation_datetime < NOW() - '336 HOURS'::INTERVAL
        AND
        vo.observation_datetime > NOW() - '360 HOURS'::INTERVAL
    ),
    obs_tail AS (
        SELECT
         obs.*
        ,row_number() over (partition BY obs.hospital_visit_id ORDER BY obs.observation_datetime DESC) obs_tail
        FROM obs
    )
    SELECT
     visit_observation_id
    ,hospital_visit_id
    ,observation_datetime
    ,value_as_real
    ,NAME
    FROM obs_tail
    WHERE obs_tail = 1
) hr -- heart rate
ON lv.hospital_visit_id = hr.hospital_visit_id

WHERE
dept.name IN (
'UCH T03 INTENSIVE CARE'
,'UCH SDEC'
,'UCH T01 ACUTE MEDICAL'
,'UCH T01 ENHANCED CARE'
,'UCH T06 HEAD (T06H)'
,'UCH T06 CENTRAL (T06C)'
,'UCH T06 SOUTH PACU'
,'UCH T06 GYNAE (T06G)'
,'UCH T07 NORTH (T07N)'
,'UCH T07 CV SURGE'
,'UCH T07 SOUTH'
,'UCH T07 SOUTH (T07S)'
,'UCH T07 HDRU'
,'UCH T08 NORTH (T08N)'
,'UCH T08 SOUTH (T08S)'
,'UCH T08S ARCU'
,'UCH T09 SOUTH (T09S)'
,'UCH T09 NORTH (T09N)'
,'UCH T09 CENTRAL (T09C)'
,'UCH T10 SOUTH (T10S)'
,'UCH T10 NORTH (T10N)'
,'UCH T10 MED (T10M)'
,'UCH T11 SOUTH (T11S)'
,'UCH T11 NORTH (T11N)'
,'UCH T11 EAST (T11E)'
,'UCH T11 NORTH (T11NO)'
,'UCH T12 SOUTH (T12S)'
,'UCH T12 NORTH (T12N)'
,'UCH T13 SOUTH (T13S)'
,'UCH T13 NORTH ONCOLOGY'
,'UCH T13 NORTH (T13N)'
,'UCH T14 NORTH TRAUMA'
,'UCH T14 NORTH (T14N)'
,'UCH T14 SOUTH ASU'
,'UCH T14 SOUTH (T14S)'
,'UCH T15 SOUTH DECANT'
,'UCH T15 SOUTH (T15S)'
,'UCH T15 NORTH (T15N)'
,'UCH T15 NORTH DECANT'
,'UCH T16 NORTH (T16N)'
,'UCH T16 SOUTH (T16S)'
,'UCH T16 SOUTH WINTER'

)
AND
lv.admission_datetime < NOW() - '336 HOURS'::INTERVAL
AND
    (lv.discharge_datetime > NOW() - '336 HOURS'::INTERVAL
     OR
      (lv.discharge_datetime IS NULL AND hv.discharge_datetime IS NULL)
    )
AND
lo.location_string NOT LIKE '%WAIT%'
AND
lo.location_string NOT LIKE '%null%'
;
To benefit from syntax highlighting, proper version control and other goodness then we’ll actually load the query from its own file. The list above is there just to improve the flow and readability of this notebook.
q = Path('utils/queries/discharges_dummy.sql').read_text()

# this handles escaping etc (e.g. % in the LIKE clause becomes %%)
q = sa.text(q)
df = pd.read_sql_query(q, emapdb_engine)Now inspect the fields
df.info()<class 'pandas.core.frame.DataFrame'>
RangeIndex: 444 entries, 0 to 443
Data columns (total 5 columns):
# Column Non-Null Count Dtype
--- ------ -------------- -----
0 id 444 non-null object
1 hours_to_discharge 263 non-null float64
2 department 444 non-null object
3 age 444 non-null float64
4 pulse 381 non-null float64
dtypes: float64(3), object(2)
memory usage: 17.5+ KBPlot the distribution, then pick a distribution and create a simple sample
LoS = df['hours_to_discharge']
LoS.describe()
count 263.000000
mean 108.049430
std 82.814341
min 1.000000
25% 43.000000
50% 86.000000
75% 157.500000
max 332.000000
Name: hours_to_discharge, dtype: float64n, bins, patches = plt.hist(LoS, bins=20)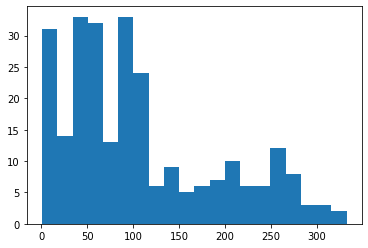
Now generate an empirical distribution that roughly matches as above by sampling with replacement
LoS_sample = LoS.sample(frac=1, replace=True)
LoS_sample.describe()
count 263.000000
mean 96.634981
std 80.698500
min 1.000000
25% 40.000000
50% 68.000000
75% 138.500000
max 305.000000
Name: hours_to_discharge, dtype: float64n, bins, patches = plt.hist(LoS_sample, bins=20)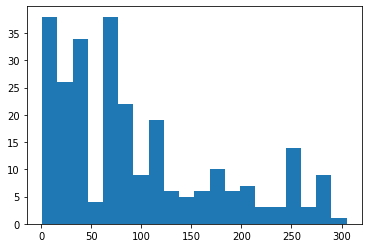
Plot the distribution, then pick a distribution and create a simple sample
department = df['department']
department.value_counts()
UCH T01 ACUTE MEDICAL 36
UCH T10 SOUTH (T10S) 35
UCH T10 NORTH (T10N) 24
UCH T09 NORTH (T09N) 24
UCH T13 NORTH ONCOLOGY 24
UCH SDEC 23
UCH T13 SOUTH (T13S) 22
UCH T08 SOUTH (T08S) 21
UCH T08 NORTH (T08N) 20
UCH T09 CENTRAL (T09C) 19
UCH T03 INTENSIVE CARE 19
UCH T12 NORTH (T12N) 18
UCH T14 NORTH TRAUMA 17
UCH T16 NORTH (T16N) 15
UCH T07 NORTH (T07N) 15
UCH T16 SOUTH WINTER 14
UCH T14 SOUTH ASU 13
UCH T06 HEAD (T06H) 12
UCH T12 SOUTH (T12S) 10
UCH T11 NORTH (T11N) 9
UCH T01 ENHANCED CARE 9
UCH T11 SOUTH (T11S) 9
UCH T07 SOUTH 7
UCH T06 CENTRAL (T06C) 6
UCH T14 NORTH (T14N) 4
UCH T06 SOUTH PACU 4
UCH T09 SOUTH (T09S) 3
UCH T06 GYNAE (T06G) 3
UCH T15 SOUTH (T15S) 2
UCH T07 SOUTH (T07S) 2
UCH T10 MED (T10M) 1
UCH T08S ARCU 1
UCH T15 NORTH (T15N) 1
UCH T11 EAST (T11E) 1
UCH T16 SOUTH (T16S) 1
Name: department, dtype: int64X = df.groupby('department')['department'].count()fig, ax = plt.subplots(dpi=1.5*72)
ax.bar(X.index, X.values)
ax.tick_params(axis='x', rotation=90)
plt.show()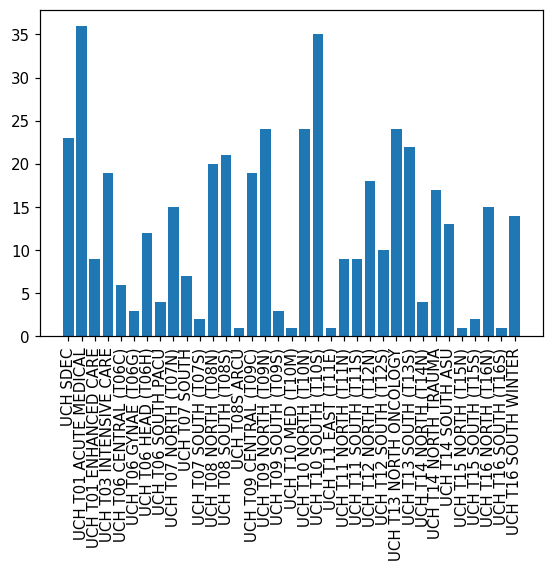
Now generate an empirical distribution that roughly matches as above by sampling with replacement
department_sample =department.sample(frac=1, replace=True)
department_sample.value_counts()
UCH T01 ACUTE MEDICAL 45
UCH T10 SOUTH (T10S) 37
UCH T09 CENTRAL (T09C) 30
UCH T13 NORTH ONCOLOGY 26
UCH T10 NORTH (T10N) 26
UCH T09 NORTH (T09N) 25
UCH T13 SOUTH (T13S) 23
UCH T03 INTENSIVE CARE 22
UCH SDEC 22
UCH T07 NORTH (T07N) 21
UCH T06 HEAD (T06H) 16
UCH T12 NORTH (T12N) 16
UCH T16 NORTH (T16N) 16
UCH T14 SOUTH ASU 14
UCH T08 SOUTH (T08S) 14
UCH T14 NORTH TRAUMA 12
UCH T16 SOUTH WINTER 12
UCH T08 NORTH (T08N) 11
UCH T11 NORTH (T11N) 10
UCH T11 SOUTH (T11S) 7
UCH T01 ENHANCED CARE 6
UCH T07 SOUTH 6
UCH T12 SOUTH (T12S) 5
UCH T06 SOUTH PACU 5
UCH T14 NORTH (T14N) 3
UCH T06 CENTRAL (T06C) 3
UCH T06 GYNAE (T06G) 3
UCH T15 SOUTH (T15S) 3
UCH T07 SOUTH (T07S) 1
UCH T15 NORTH (T15N) 1
UCH T16 SOUTH (T16S) 1
UCH T10 MED (T10M) 1
UCH T09 SOUTH (T09S) 1
Name: department, dtype: int64X_s = department_sample.value_counts()
X_s = X_s.reindex(X.index)
fig, ax = plt.subplots(dpi=1.5*72)
ax.bar(X_s.index, X_s.values)
ax.tick_params(axis='x', rotation=90)
plt.show()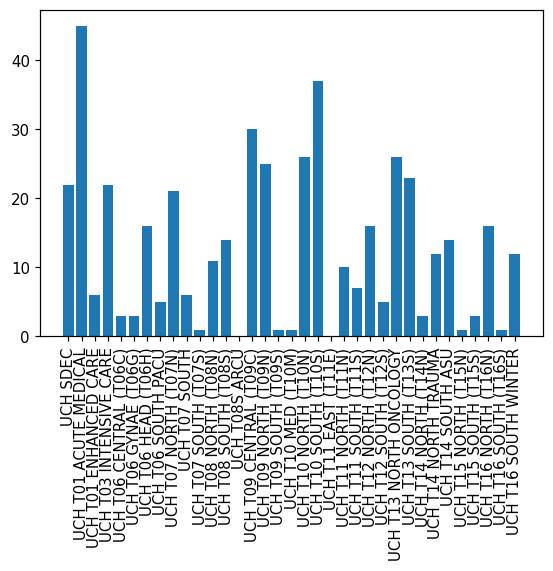
Plot the distribution, then pick a distribution and create a simple sample
age = df['age']
age.describe()
count 444.000000
mean 57.927928
std 23.748289
min 0.000000
25% 40.000000
50% 65.000000
75% 75.000000
max 100.000000
Name: age, dtype: float64n, bins, patches = plt.hist(age, bins=20)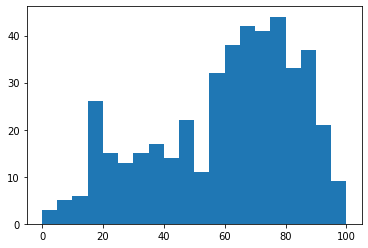
Now generate an empirical distribution that roughly matches as above by sampling with replacement
age_sample = age.sample(frac=1, replace=True)
age_sample.describe()
count 444.000000
mean 58.355856
std 22.933793
min 5.000000
25% 43.750000
50% 65.000000
75% 75.000000
max 100.000000
Name: age, dtype: float64n, bins, patches = plt.hist(age_sample, bins=20)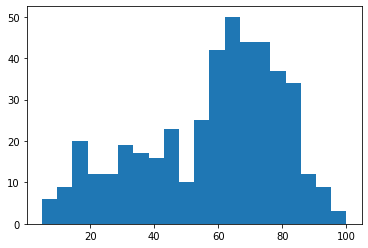
Plot the distribution, then pick a distribution and create a simple sample
pulse = df['pulse']
pulse.describe()
count 381.000000
mean 81.391076
std 17.147712
min 42.000000
25% 70.000000
50% 80.000000
75% 90.000000
max 187.000000
Name: pulse, dtype: float64n, bins, patches = plt.hist(pulse, bins=20)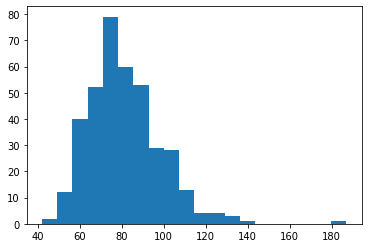
Now generate an empirical distribution that roughly matches as above by sampling with replacement
pulse_sample = pulse.sample(frac=1, replace=True)
pulse_sample.describe()
count 375.000000
mean 79.696000
std 15.435336
min 46.000000
25% 68.500000
50% 78.000000
75% 89.000000
max 133.000000
Name: pulse, dtype: float64n, bins, patches = plt.hist(pulse_sample, bins=20)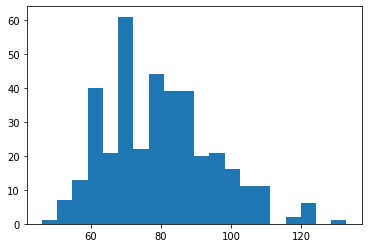
pulse_sample115 59.0
363 102.0
317 72.0
257 60.0
265 NaN
...
237 NaN
118 87.0
47 78.0
253 63.0
394 77.0
Name: pulse, Length: 444, dtype: float64LoS_sample.reset_index(inplace=True, drop=True)
department_sample.reset_index(inplace=True, drop=True)
age_sample.reset_index(inplace=True, drop=True)
pulse_sample.reset_index(inplace=True, drop=True)df_dummy = pd.concat([LoS_sample, department_sample, age_sample, pulse_sample], axis=1)df_dummy.reset_index(inplace=True)df_dummy.rename({'index': 'id'}, axis=1, inplace=True)df_dummy.head()| id | hours_to_discharge | department | age | pulse | |
|---|---|---|---|---|---|
| 0 | 0 | 42.0 | UCH T11 NORTH (T11N) | 60.0 | 59.0 |
| 1 | 1 | NaN | UCH T03 INTENSIVE CARE | 65.0 | 102.0 |
| 2 | 2 | 132.0 | UCH T13 NORTH ONCOLOGY | 60.0 | 72.0 |
| 3 | 3 | 206.0 | UCH T01 ACUTE MEDICAL | 10.0 | 60.0 |
| 4 | 4 | 90.0 | UCH T11 SOUTH (T11S) | 65.0 | NaN |
Write dummy data out. Use sqlite to manage typing etc.
sqlite_engine = sa.create_engine('sqlite:///data/dummy.db')
df_dummy.to_sql('discharges', con=sqlite_engine, if_exists='replace')
Now demonstrate that you can use those data
# remember `///` for sqlite file paths
engine = sa.create_engine('sqlite:///../../data/dummy.db')
df = pd.read_sql('select * from discharges', engine)